MARINE SPATIAL PLANNING TOOL
MSP TOOL
WebGIS Platform for tidal in-stream current energy development
PhilSHORE Tool
Marine Spatial Planning Tool
The PhilSHORE Tool has 4 different sub-systems. The accounts sub-system which handles user registration and information. The user and module management sub-system which allows the administrator of the application to grant access to a user. The data management sub-system act as the main repository for the resource,suitability and device layers. And the WebGIS sub-system where an interactive map is shown and where a user or client can visualize the output of the different components of the team.
The WebGIS or PhilSHORE’s functions can be found on the collapsible sidebar positioned on the left side of the interface. The feature sidebar has six main feature panels which includes Search, Pixel Data, Map Layers, Weighted Overlay, Site & Device Analysis and Site-Data Distributions. Other interface widgets include map buttons, for sidebar collapse, map zoom, reset view and fullscreen, and controls for an overview map, scale and tile attribution.
Map Layers: The Map Layers panel allows the user to toggle the visibility of the listed layers such as site-suitability, its individual factors and a corresponding device. The layer indexing assigns the highest index to the layer which was last toggled. The device layer was assigned to always have the highest index. Basemaps, the background tiles shown on the map, can be switched to different tile providers. The basemap tile choices includes MapQuest Satellite, OSM Streetmap, and a hybrid between the two.
Site & Device Analysis: The Site & Device Analysis panel allows the users to select a TISEC device layer to be added. These device layers contains site information specific for each of the device particularly the availability and capacity factors.
Pixel Data: If an overlay layer is added through the Map Layers panel, if the overlay is clicked, the corresponding data on that pixel is displayed on the Pixel Data panel. Parallel pixel data identification can be performed by adding several layers on the Overlays in the Map Layers panel.
Weighted Overlay: This feature provides the user the ability to create a customized site-suitability by adjusting the weights of the identified site-suitability factors which were Environmental, Physical, Socio-economic, Risks, and Energy Resource, according to their own preference. The output of this calculator is a raster layer which is immediately appended in the map.
Site-Data Distributions: In this panel, the user can view the monthly velocity, monthly power, and velocity histogram of the clicked site (data pixel) for the designated modeling period.
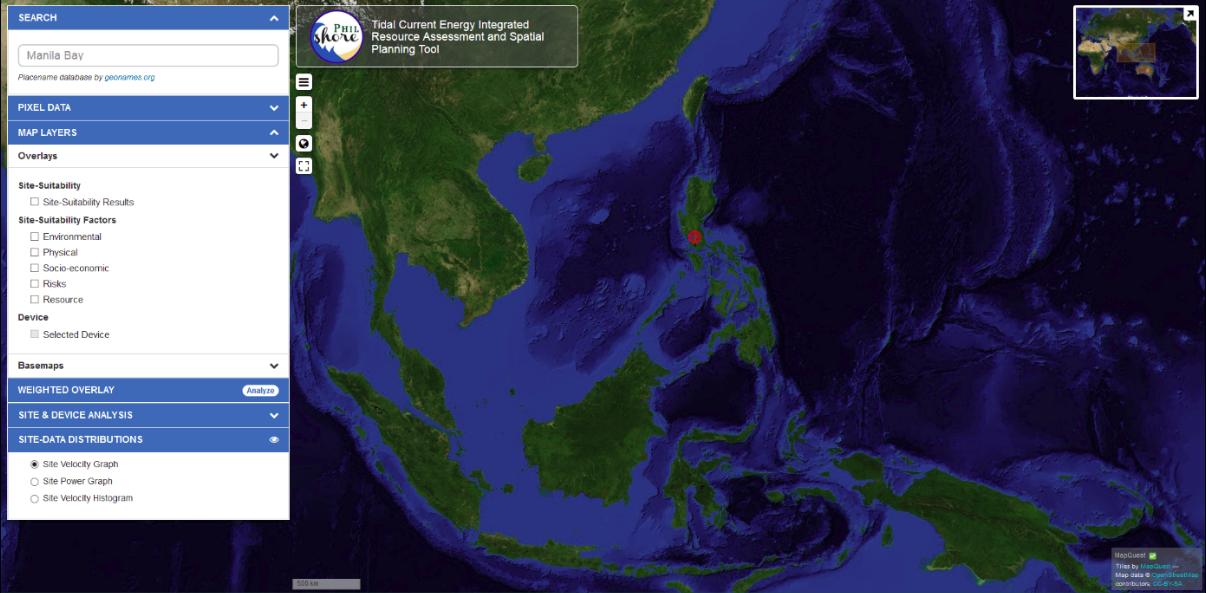
PhilSHORE WebGIS Interface
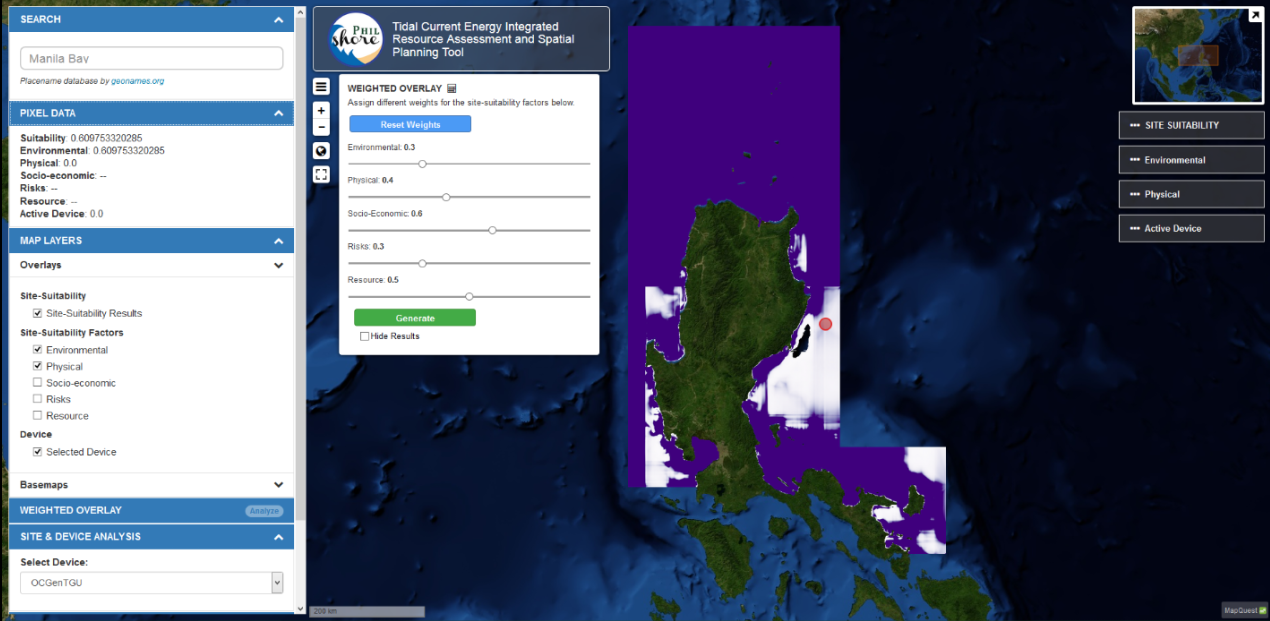
Raster output of the weighted overlay calculator
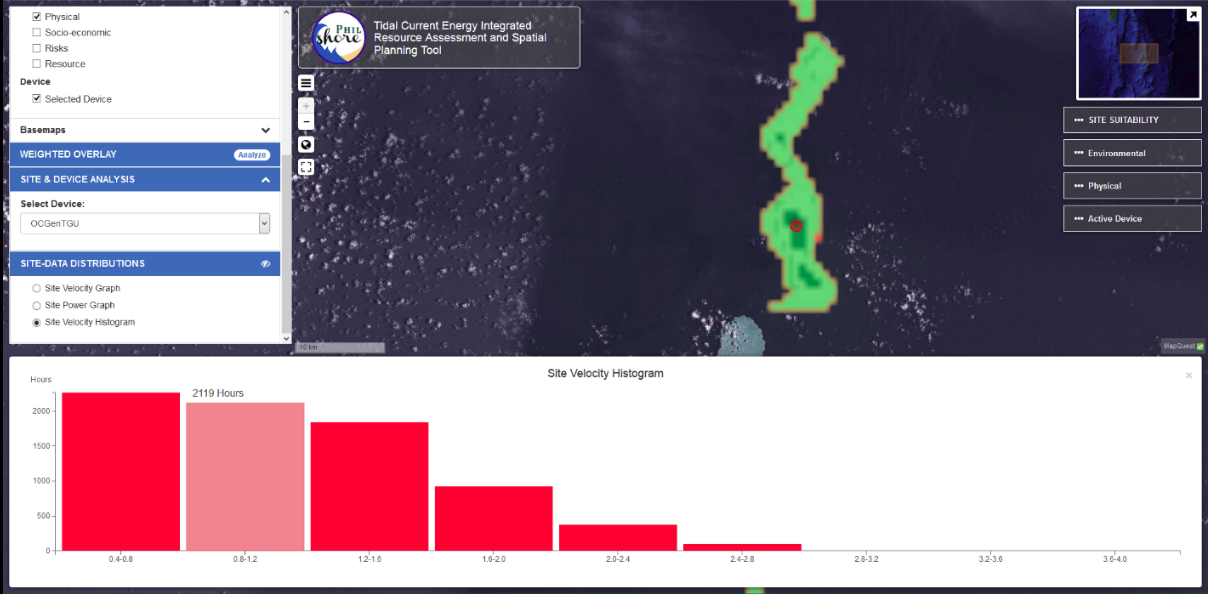
Site Velocity Histogram